
Dr. Susmit Kumar, Ph.D.
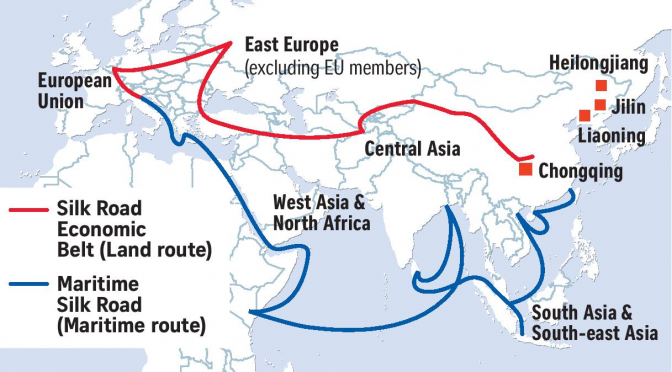
Under the OBOR (One Belt One Road) project, China is planning to spend more than $1 trillion to reshape the global economy. The question is whose $1 trillion China has been spending so far in making countries all over the world like colonies of the East India Company, by providing them loans which they would not be able to payback at all. Sri Lanka is already in China’s debt trap not being able to pay an $8 billion infrastructure loan from China. Sri Lanka's debt situation is severe. The country is currently in $58.3 billion deep to foreign financiers. 95.4% of all government revenue is currently going towards paying back loans. Out of every one hundred dollars the government brings in, only $4.60 is going towards essentials like education and public services (“China Tells Sri Lanka: We Want Our Money, Not Your Empty Airport”, Wade Shepard, www.forbes.com, July 31, 2016). Still China is willing to give another $24 billion to Sri Lanka as a part of OBOR ('China willing to give Sri Lanka $ 24 billion more as part of OBOR', PTI, May 17, 2017).
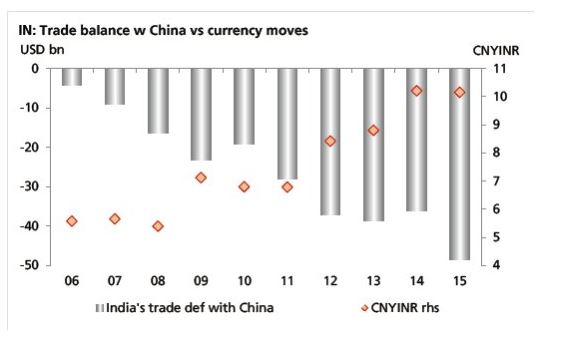
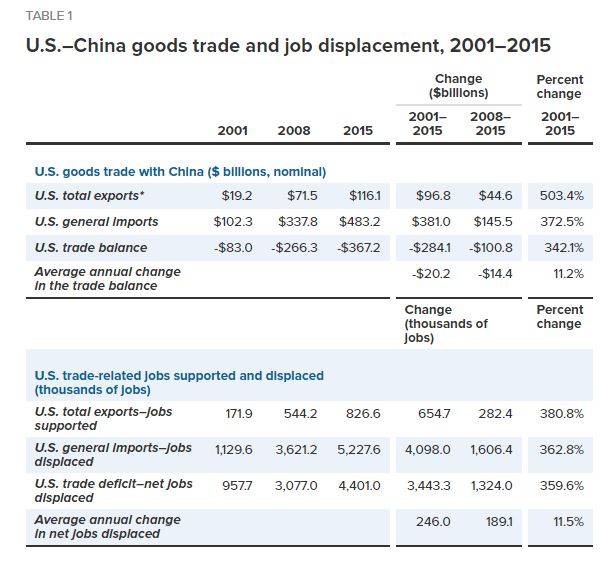
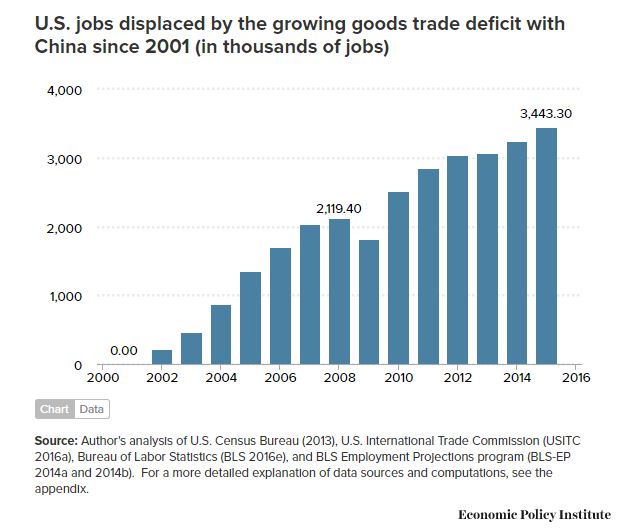
One important question is whose $1 trillion China has been spending all over the world? Most of this money comes from factory workers in the US Rust Belt whose jobs went to China due to constant Wall Street pressure on CEOs/managements of US firms to show profit every quarter. As is clear from Chart 1, some of the $1 trillion is of Indian origin also. In only the recent decade, India had more than $300 billion (it includes trade deficit in 2016 also) cumulative trade deficit with China. Both China and India kicked off economic liberalization programs in the early 1990s. Since the 1990s, India has run trade deficits year after year whereas China generated trade surpluses. Our economists and the political leaders who depended on the former, gave the $300 billion to China. As shown in Charts 2 and 3, US cumulative trade deficit with China during 2001-16 was about $4 trillion, due to which more than 3.4 million jobs were lost in the US during 2001-15. An equivalent amount of jobs were created in China. Similarly, India also lost jobs to China corresponding to $300 billion. As explained in my article The Hidden Cost of Imported Items and The Need to Redefine Modi Administration’s “Make in India” Policy”, the total number of jobs lost to China may be two to three times of the direct factory jobs for $300 billion, if we consider indirectly associated jobs also such as in schools, hospitals, and auto sector as factory workers would spend their income in these associated fields. Last year India’s trade deficit with China was $52 billion, which would have created $100 billion to $120 billion (just for sake of an example) additional economic activities in India. Last couple of years, India had about $130 billion trade deficit a year which means that Indian economy is losing about $260 billion (considering the loss of associated jobs), nearly 13% of GDP (which is about $2 trillion), of economic activity each year.
As shown in Charts 1 and 2, India’s trade deficit with China is increasing on the same pattern of US trade deficit with China. In 2015-16 fiscal year, India exported goods worth only $9 billion whereas it imported goods worth $62 billion from China, resulting in $53 billion trade deficit with China (“India's trade deficit with China jumps to $53 billion in 2015-16” PTI, August 1, 2016). In 2016, US exports to China were only $116 billion while imports from China were $463 billion, resulting in a $347 billion trade deficit (“Why Is America's Trade Deficit With China So High?”, Kimberly Amadeo, August 17, 2017, https://www.thebalance.com/u-s-china-trade-deficit-causes-effects-and-solutions-3306277). In my 2012 book Casino Capitalism, there is a sub-section titled “Rise of China due to Reaganomics – A Treason” (pp 32-35) which is an article at my website also Rise of China due to Reaganomics—A Treason.
After the division of Pakistan in 1971, Z.A. Bhutto once said that Pakistanis would eat grass but they would make nuclear bomb. After the Indian government had to airlift its 67 ton gold to London to get $2.2 billion loan from the IMF in 1991, India needed a similar resolve for its economy to have trade surplus. But instead India followed the “Reaganomics” economic policy, mainly due to the US educated economists at the helm of the administration, due to which the US had trade deficit every year since early 1970s. The US was able to sustain twin deficits – both budget and trade deficit – by just printing its currency which happened to be the global currency. The Indian administration failed to realize that India could not do the same. At the time, the East Asian Miracle countries were already experiencing phenomenal growth rates rates along with trade surplus each year.
Just four years ago, Indian economy was in the midst of a grave crisis. Due to record trade deficits during 2011-13, the exchange rate of the rupee (vis-à-vis the US dollar) tumbled from 44.17 in April 2011 to 62.92 in September 2013. After the sharp devaluation of the Indian rupee and double digit inflation during 2011-13 due to the high crude oil price, some economists even started to write the obituary of the Indian economy (read: "None of the experts saw India's debt bubble coming. Sound familiar?", The Guardian, UK, August 26, 2013; ‘Fragile Five’ Is the Latest Club of Emerging Nations in Turmoil, New York Times, January 28, 2014). One point worth noting is that Russia and China were not included in the new club of “Fragile Five”. Both Russia and China have been running trade surpluses since the early 2000s. Had high crude oil price persisted for a couple of more years, it was certain that India would have had to go to the emergency ward of the IMF, wiping out its couple of decades of development due to the IMF’s bitter medicine of getting rid of subsidies to balance the budget, significant increase in the interest rate, and selling the crown public sectors to Wall Street bankers at throwaway prices.
The US economic model that lost millions of jobs related to
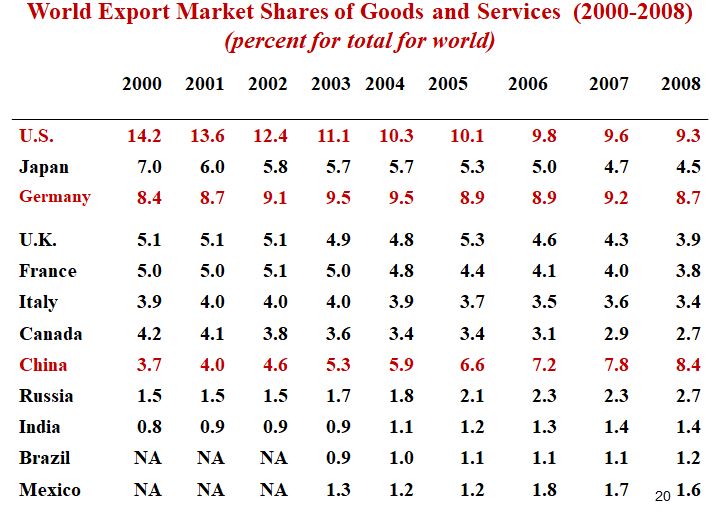
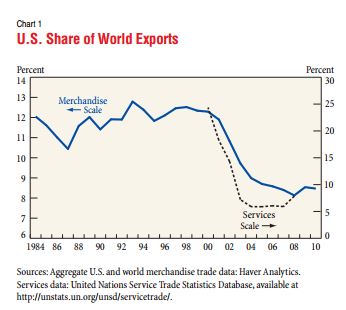
- a decrease of nearly 35% (from 14.2% in 2000 to 9.3% in 2008) of the world export market in just eight years (thereafter it is hovering around 9%) as shown in Tables 2 and 3, and Chart 5, and also
- the goods for its own consumption corresponding to record increase in trade deficit since mid 1990s as shown in Charts 6 and 7.
Despite the historic loss of millions of middle class jobs during 2000 to 2008 and job losses related to the record increase in its trade deficit since 1990s, the US economy kept on booming, firstly due to the tech stock bubble, and secondly the real estate price bubble. When the real estate bubble burst in 2008, the Bush administration (and later the Obama administration) had to spend trillions of dollars to prop-up banking and real estate sectors. During the early 1990s and early 2000s US economic recessions, the Fed could counter the recession by lowering interest rates, as shown in Chart 8. But the same treatment by the Fed is not working now despite the interest rate having been kept to a historic zero level since the 2008 Great Recession. The reason for its failing is that this time banks are not finding enough people, with good credit rating (as they do not have good paying jobs), to provide loans to. The US economy has a deadly cancer (massive loss of good paying jobs) whereas the zero interest rate is just a pain-killer. The low interest rate is not the cure this time.
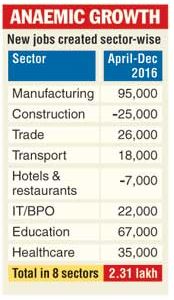
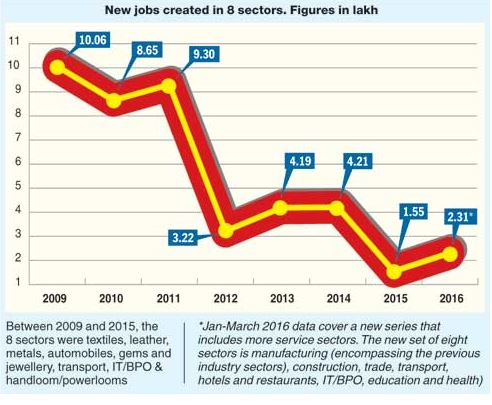
Like the US jobless recovery since the 2008 Great Recession (“Why the U.S. Has a Monopoly on Jobless Recoveries,” Noah Smith, Bloomberg News, January 23, 2017), India has been experiencing jobless growth (“Where are the jobs?,” Shweta Punj and MG Arun, India Today website, April 20, 2016). According to a recent report, while the economy is growing at just over 7% per year, jobs increased by just 1.1% last year, covering eight key sectors of the nonfarm economy. An earlier report had pegged joblessness at a five year high of 5% in 2015, and underemployment at a staggering 35% of the over 15-years labor force (“Economy growing at 7%, jobs at 1%”, Subodh Varma, Times News Network, May 19, 2017; ).
(Source: https://www.telegraphindia.com/1170518/jsp/frontpage/story_152234.jsp)
(Source: https://www.telegraphindia.com/1170518/jsp/frontpage/story_152234.jsp)
Chart 1. India’s Trade Deficit with China:
(Source: http://www.dbs.com/in/personal/aics/templatedata/article/generic/data/en/GR/082015/150814_economics_weak_yuan_to_widen_india_china_trade_deficit.xml)
Chart 2.US Trade Deficit with China:
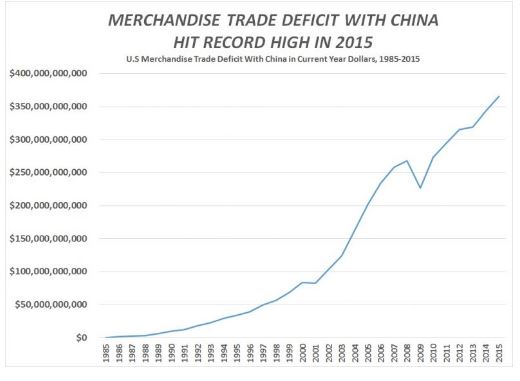
Chart 3:
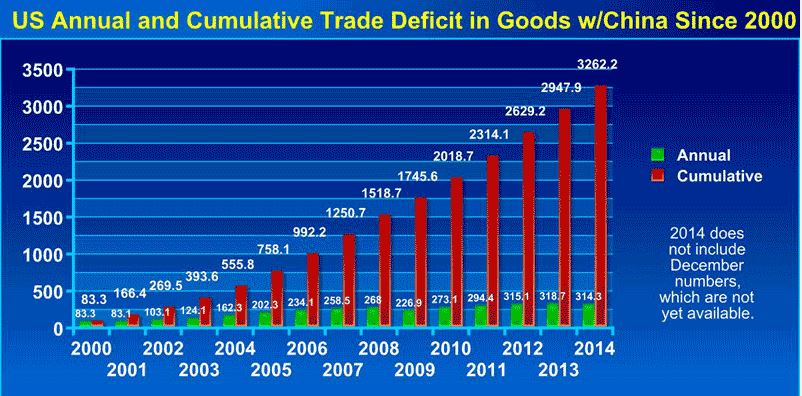
Table 1:
(Source: http://www.epi.org/publication/growth-in-u-s-china-trade-deficit-between-2001-and-2015-cost-3-4-million-jobs-heres-how-to-rebalance-trade-and-rebuild-american-manufacturing/)
Chart 4:
(Source: http://www.epi.org/publication/growth-in-u-s-china-trade-deficit-between-2001-and-2015-cost-3-4-million-jobs-heres-how-to-rebalance-trade-and-rebuild-american-manufacturing/)
Table 2:
(Data source: World Economic Outlook which is published twice a year by IMF)
Table 3:
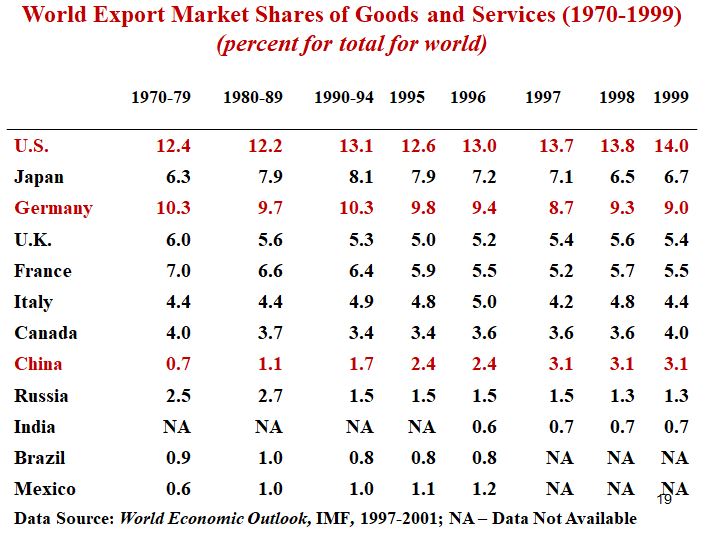
Chart 5 US Share of World Exports:
(Source: “Why Is the U.S. Share of World Merchandise Exports Shrinking?,” Benjamin R. Mandel, Current Issues in Economics and Finance (Federal Reserve Bank of New York), Volume 18, Number 1, 2012,
accessed at: https://pdfs.semanticscholar.org/a7e5/df2ffaa6e85d45856f7f0a98f048286c543c.pdf)
Chart 6. US Monthly Balance of Trade (1950-75):
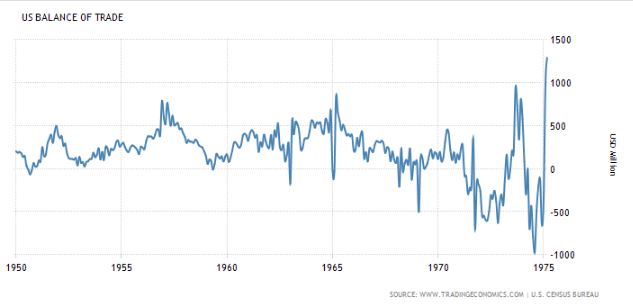
Chart 7. US Monthly Balance of Trade (1975-2017):
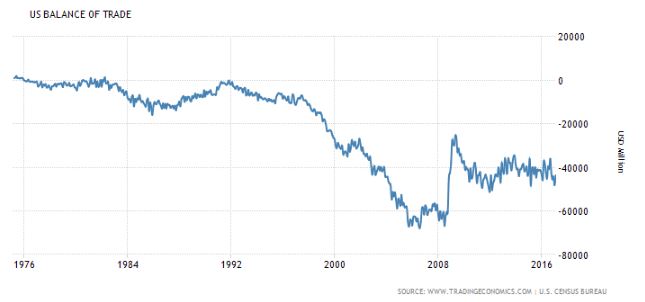
Chart 8:
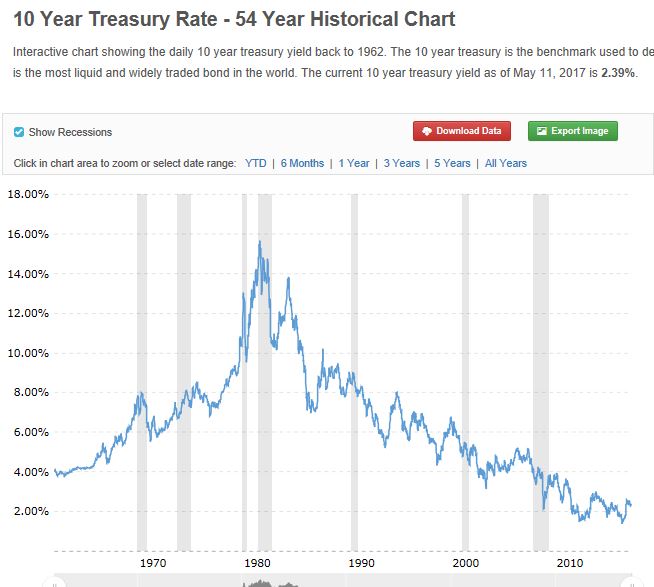
(Source: http://www.macrotrends.net/2016/10-year-treasury-bond-rate-yield-chart)
Dear Sir, correct, OBOR is another highway robbery by Chinese neocolonial capitalist government. regards, Prasanna Jayasuriya,Colombo