Dr. Susmit Kumar, Ph.D.
The two tables and six charts shown below prove which economic model India should follow, either:
-
The US economic model that lost millions of jobs related to:
– a decrease of nearly 35% (from 14.2% in 2000 to 9.3% in 2008) of the world export market in just eight years (thereafter it is hovering around 9%), and also
– the goods for its own consumption corresponding to record increase in trade deficit since mid 1990s (as shown in Chart 1), or - The Chinese, 3.7% in 2000 to 8.4% in 2008, a 127% increase, and the German which has kept a steady percentage despite the rise of the global Chinese workshop.
One point worth noting is that the US economy was in severe recession at the onset of economic crisis in 2008 whereas both China and Germany did not have a similar issue. Even a high school student will tell you not to ask US economists for advice but instead adopt a combination of the German and Chinese economic models.
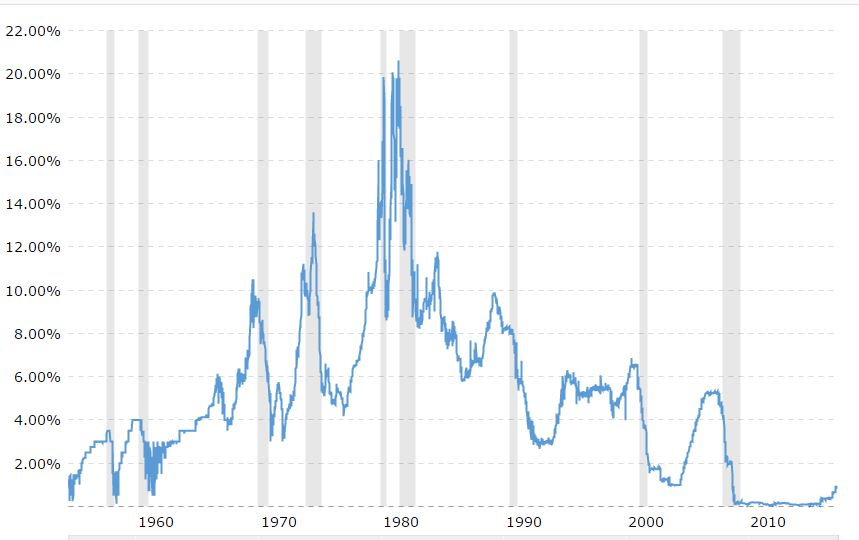
Despite the historic loss of millions of middle class jobs during 2000 to 2008 and job losses related to the record increase in its trade deficit in this period, the US economy kept on booming firstly due to the tech stock bubble and then the real estate price bubble. When the real estate bubble burst in 2008, the Bush administration (and later the Obama administration) had to spend trillions of dollars to prop-up banking and real estate sectors. During the early 1990s and 2000s US economic recessions, the Fed could counter the recession by lowering interest rates, as shown in Chart 6. But the same treatment by the Fed is not working now despite the interest rate having been kept to a historic zero level since the 2008 Great Recession. The reason for its failing is that this time banks are not finding enough people, with good credit rating (as they do not have good paying jobs), to provide loans to. The US economy has a deadly cancer (massive loss of good paying jobs) whereas the zero interest rate is just a pain-killer. The low interest rate is not the cure this time.
The US is a bankrupt country surviving by printing its currency, which happens to be the global currency (read my article The US Dollar – A Ponzi Scheme). The only attacking weapon in the arsenal of the US economists appears to be to increase share prices. At the onset of the 2008 recession, the economies of the East European countries were on the verge of collapse. In an October 2008 speech, Romanian President Traian Basescu pinned the blame on “corrupt” outsiders. He said, “There were smart guys coming to Romania, who had studied at Harvard and Oxford, and they invented how to increase the value of one’s shares without actually having money.” (Craig Whitlock, “Financial Crisis Leaves Romania Reeling,” Washington Post, November 5, 2008.) His statement describes in brief the Reaganomics, the current fundamentals of the US economics. Wall Street has created and sold the US to its Frankenstein China.
Dr Manmohan Singh (previous Prime Minister of India) is credited world-wide for the 1991 economic liberalization of India. Actually, he was forced to do so under the IMF dictates when India had to airlift 67 tons of gold to London to get a loan from IMF to overcome FOREX crisis. I give a “Fail” grade to Dr Singh for his work. Both China and India started their new phase of economic liberalization at the same time, in the early 1990s, but China is now the global economic leader whereas India is nowhere. Yes, the growth rate of India in last couple of years is the highest in the world but it is vulnerable to economic collapse, due to an economic crisis as a result of generating trade deficits year on year. For 15 years out of the 25 years since economic liberalization, Dr Singh was at the helm of the government to steer the Indian economy: first five years as Finance Minister and then ten years as Prime Minister for two terms. People blame high crude oil prices for the economic crisis during 2011-13, a time when economists were writing obituaries of the Indian economy (read: "None of the experts saw India's debt bubble coming. Sound familiar?", The Guardian, UK, August 26, 2013; "‘Fragile Five’ Is the Latest Club of Emerging Nations in Turmoil", New York Times, January 28, 2014), but blame “lies” on Dr. Manmohan Singh who did little to try to turn perennial trade deficits into trade surpluses. Due to the record trade deficit during 2011-13, the exchange rate of India’s rupee (vis-à-vis the US dollar) tumbled from 44.17 in April 2011 to 62.92 in September 2013. One point worth noting is that Russia and China were not included in the new club of “Fragile Five”. Both Russia and China have been running trade surpluses since the early 2000s. Had high crude oil price persisted for a couple of more years, it was certain that India would have had to go to the IMF to take loan, which would have destroyed the Indian economy for next decade or longer, due to the IMF’s bitter medicine of getting rid of subsidies to balance the budget, significant increase in the interest rate, and selling the crown public sectors to Wall Street bankers at throwaway prices.
Table 1 World Export Market Shares of Goods and Services 2000-2008:
(Data source: World Economic Outlook which is published twice a year by IMF):
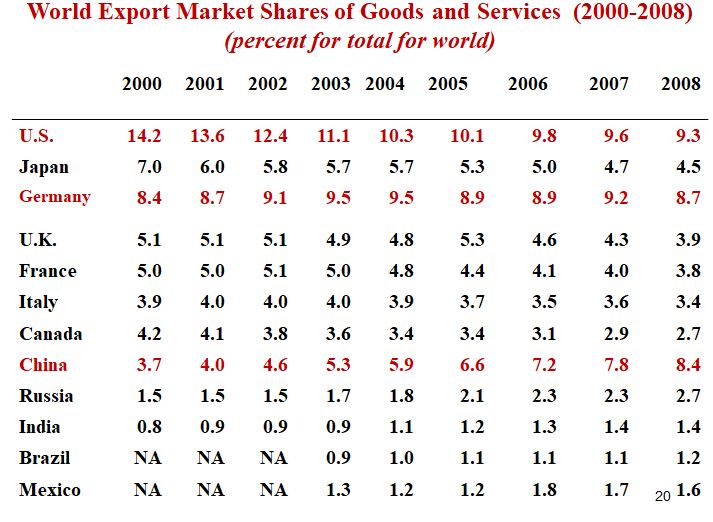
Table 2 World Export Market Shares of Goods and Services 1970-1999:
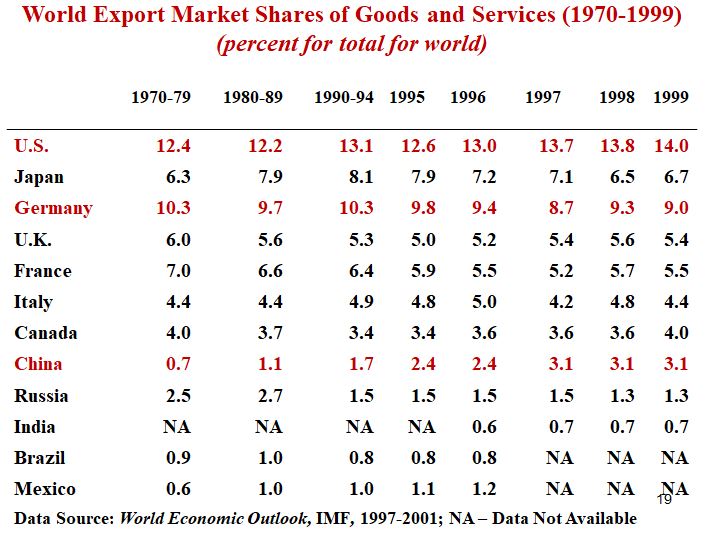
Chart 1 US Monthly Balance of Trade (1975-2017):
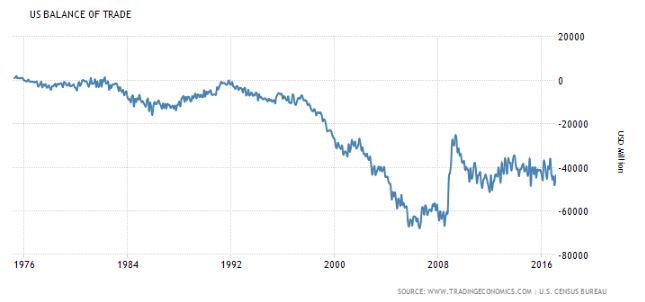
Chart 2 US Share of World Exports:
(Source: “Why Is the U.S. Share of World Merchandise Exports Shrinking?,” Benjamin R. Mandel, Current Issues in Economics and Finance (Federal Reserve Bank of New York), Volume 18, Number 1, 2012,
accessed at: https://pdfs.semanticscholar.org/a7e5/df2ffaa6e85d45856f7f0a98f048286c543c.pdf)
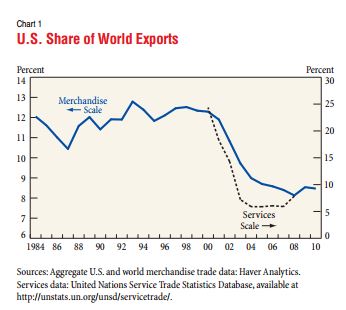
Chart 3 US Trade Deficit with Various Countries (in USD billions):

Chart 4 The 20 Countriers with the Highest Trade Surplus in 2015 (in USD billions) :
(source: https://www.statista.com/statistics/256642/the-20-countries-with-the-highest-trade-surplus/)
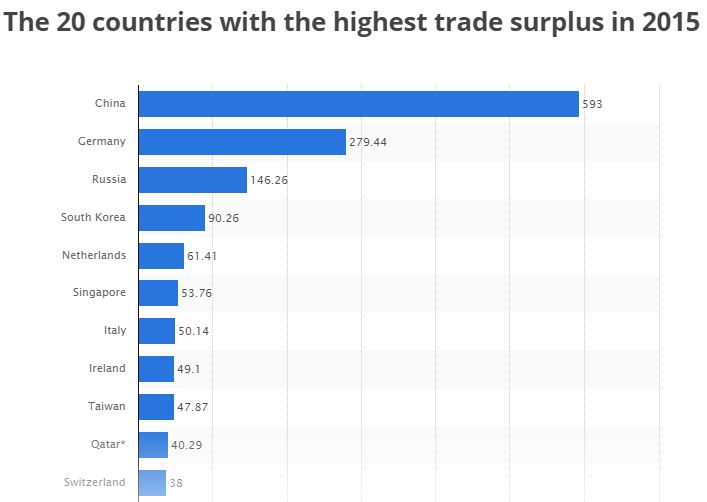
Chart 5 Largest Trade deficit by Country (in USD billions):
(source: http://www.worldsrichestcountries.com/trade-deficits-by-country.html)
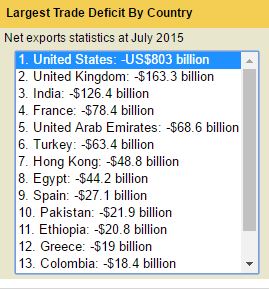
Chart 6 US Fed Rate:
(Source: http://www.macrotrends.net/2015/fed-funds-rate-historical-chart)