Susmit Kumar, Ph.D.
 A Brief History Of The Global Economy
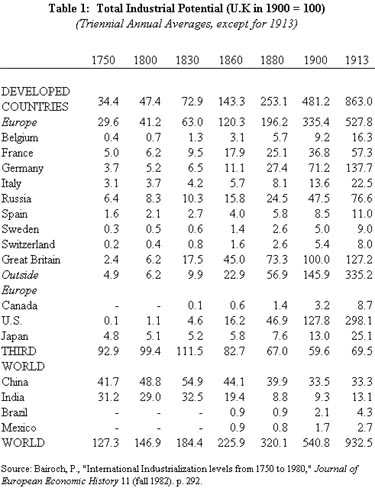
Until 700 to 800 years ago, the various continents exhibited little difference in wealth and poverty. The industrial revolution in Europe, however, created vast differences in wealth between rich and poor countries due to the fact that the colonies were deprived of the use of the “new technologies.” As shown in Tables 1 and 2, the economies of Third World countries like India, China, and Brazil were comparable to those of what are now the developed countries until 1750, but due to exploitation of their resources and trade restrictions their economies declined.
During the 18th century, for example, the British imposed trade restrictions on Indian textile exports, which were better than British machine-manufactured textiles, to safeguard its own textile industry. India experienced zero per capita growth from 1600 to 1870, the period of growing British influence. Per capita economic growth from 1870 to independence in 1947 was a meagre 0.2 percent per year, compared with 1 percent in the UK.
The U.K. and other European countries achieved tremendous economic growth in the 1800s at the expense of the economic growth of their colonies until the two world wars ended this scheme. The U.S. then took over economic leadership when European nations had to take American war loans and due to the boost these wars gave American industry. The U.S. supplied billions of dollars’ worth of munitions and foodstuffs to the Allies during two World Wars, and the Allies had to borrow money on the New York and Chicago money markets to pay for them. By the late 1940s, the U.S. gross domestic product (GDP) was almost half of the world’s GDP, and American companies were working at full capacity. This contrasts dramatically with post-war Europe, most of whose factories had been completely destroyed. In addition, technological advances in both ocean and air transport during the war made the transportation of goods cheap, integrating the American economy into the world economy.
The war also caused the demise of the world’s two main colonial powers, Britain and France. Britain’s national debt was about 250 percent of its GDP in 1946. This forced them to grant independence to most of their colonies, which were too expensive to keep within the colonial fold.
World War II also saw the emergence of the U.S.S.R., which initially demonstrated tremendous economic growth. Soviet rulers claimed that they would surpass the economic might of the West, but after a few decades the Soviet economic miracle fizzled out once the drawbacks of communism, including inefficiency and relatively poor productivity, crept into the Soviet economy. This finally led to the collapse of the Soviet empire in 1991.
Due to the Korean War, the Japanese and South Korean economies were rebuilt on the ruins of World War II. After the oil price increases in the late 1970s and subsequent inflation, U.S. industries started shifting their production to East Asia, creating the four “Asian Tigers,” namely, South Korea, Hong Kong, Taiwan, and Singapore. Since these four countries were too small to produce all the manufactured goods needed for the U.S. consumer market, Chinese businessmen in Hong Kong, Taiwan, and Singapore invested in countries like Indonesia, Thailand, and Malaysia, where the Chinese origin people had a monopoly on industry. This finally led to the rise of China. The losers were American workers, who were laid off on a large scale. The advent of information technology in the mid-1990s created jobs in the U.S., but to satisfy the profit demands of Wall Street investors, CEO’s had to send information technology jobs to countries like India, Ireland, and Philippines.
Post-1990s Casino Capitalism
Let us discuss the 1997 East Asian crisis, the recent record gasoline prices and the current global economic crisis to see how casino capitalism is playing havoc with the common people.
With the entry of China in the US consumer market in the 1990s, its trade surplus started increasing at the expense of other East Asian countries, notably Thailand, South Korea, Malaysia, Indonesia and Philippines. In 1994, China devalued its currency Yuan by 35 percent whereas other East Asian countries delayed devaluation until 1997; however, the damage was already done as their imports began to exceed their exports and they became vulnerable to currency speculators. Thailand had the weakest economy in the region because of its high debts, which were about 38 percent of GDP. When currency traders saw the vulnerability of the Thai economy, they bought several forward contracts worth more than $15 billion and flooded the international market by selling bahts, the Thai currency, in May 1997. Thailand’s central bank initially spent more than $16 billion in its failed attempt to prop up its currency. When its FOREX dropped into the danger level, it had to unpeg the baht from the dollar, resulting in a free-fall for the Thai currency. It led to domino effect in entire region, leading to sharp devaluation of currencies, massive loss of jobs and stock market crashes. In Thailand, people invested a lot of money in real estate, but since there were not enough buyers, the real estate market crashed. It was due to Thailand’s real estate sector that most East Asian economies eventually suffered, but currency speculators made a lot of money.
After watching the IMF at work during the 1997 East Asian economic crisis, Joseph E. Stiglitz, 2001 winner of Nobel Prize in economics, wrote in April 2000:
“I was chief economist at the World Bank from 1996 until last November, during the gravest global economic crisis in a half-century. I saw how the IMF, in tandem with the U.S. Treasury Department, responded. And I was appalled.”
“The IMF may not have become the bill collector of the G-7, but it clearly worked hard (though not always successfully) to make sure that the G-7 lenders got repaid.”
It was he who described the crisis best:
“The IMF first told countries in Asia to open up their markets to hot short-term capital [It is worth noting that European countries avoided full convertibility until the 1970s.]. The countries did it and money flooded in, but just as suddenly flowed out. The IMF then said interest rates should be raised and there should be a fiscal contraction, and a deep recession was induced. As asset prices plummeted, the IMF urged affected countries to sell their assets even at bargain basement prices. It said the companies needed solid foreign management (conveniently ignoring that these companies had a most enviable record of growth over the preceding decades, hard to reconcile with bad management), and that this would happen only if the companies were sold to foreigners—not just managed by them. The sales were handled by the same foreign financial institutions that had pulled out their capital, precipitating the crisis. These banks then got large commissions from their work selling the troubled companies or splitting them up, just as they had got large commissions when they had originally guided the money into the countries in the first place. As the events unfolded, cynicism grew even greater: some of these American and other financial companies didn’t do much restructuring; they just held the assets until the economy recovered, making profits from buying at fire sale prices and selling at more normal prices.”
In his U.S. Senate testimony in May 2008, Michael Masters, a hedge fund manager, blamed speculators for the record rise in oil prices, citing U.S. government data that over the last five years demands from speculators (848 million barrels) were almost the same as the Chinese oil demand (920 million barrels) over the same period. In his weekly New York Times column, Paul Krugman criticized Michael Masters’ theory of hedge funds as being mainly responsible for the oil price rise, by claiming that the price of iron ore paid by Chinese steel makers to Australian miners had jumped by 95 per cent. Iron ore is not traded in the global exchange. But Krugman failed to consider the fact that the price paid by Chinese Steel makers to Australian miners was the delivered cost to China and it reflected the higher transportation costs due to record gasoline prices. Gasoline prices had more than doubled in the last one year when this deal was signed.
Four dollar a gallon gas prices created havoc in the US economy. The best-selling gas-guzzling SUV market dropped drastically, causing auto manufacturers like GE, Ford and Chrysler to close down their manufacturing plants and showrooms and lay off tens of thousands of workers. Although oil companies were raking in record tens of billions of dollars in profits each quarter, higher gas prices were causing a rise in transportation costs, raising the price of all food products in super markets. This increased inflation. It affected the sales of supermarkets like Walmart and Kmart as higher food and gas prices left fewer dollars in the pockets of lower income people to spare. All over the world, hundreds of millions of people fell below the poverty line because of double digit inflation due to rising food costs. Oil-importing countries like India had to spend up to 2 to 3 percent of its GNP as subsidy on gasoline as a substantial rise in gasoline price would have destabilized the entire country.
Derivatives are behind the recent global economic crisis. Derivatives are financial contracts whose values are derived from the value of something else (loans, bonds, commodities, equities (stocks), residential mortgages, commercial real estate, loans, bonds, interest rates, exchange rates, stock market indices, consumer price index, weather conditions or other derivatives). These can be termed as modern financial casino games. Warren Buffett famously described derivatives bought speculatively as "financial weapons of mass destruction."
As an example, a credit default swap (CDS) is a credit derivative contract between two parties. In mid-1990s, CDS was invented by a JP Morgan Chase team. The CDS buyer makes a series of payments to the CDS seller, and in return receives a payoff if the underlying financial instrument defaults (a mortgage, loan, bond, etc.). Unlike insurance, the CDS buyer does not need to own the underlying financial instrument (i.e. loan, bond, etc.). In mid 2008, the global derivatives market was close to $530 trillion. The global CDS market increased from $900 billion in 2000 to $55 trillion in mid 2008. In comparison, the value of the New York Stock Exchange was $30 trillion at the end of 2007 before the start of the recent crash. American International Group (AIG), the world's largest private insurance company, had sold $440 billion in credit-default swaps tied to mortgage securities. When the housing bubble burst, the CDS’ tied to mortgage securities began to send shock waves throughout the global market. To prevent a chain reaction, the U.S. government had to rescue AIG and get a $700 billion fund from the U.S. Congress to bailout Wall Street firms, as AIG and several others were running out of money after being downgraded by credit-rating agencies because of mounting losses, which triggered a clause in its credit-default swap contracts to post billions in collateral.
Collapse of The American Economy
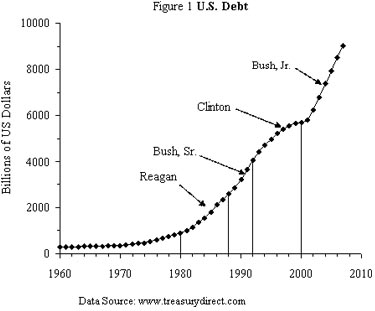
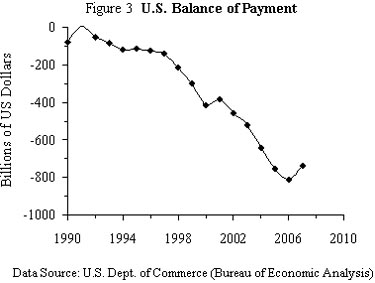
The debt crisis started by the Reagan administration is becoming unsustainable. Although the Clinton administration was able to balance the budget, and even had budget surpluses its last two years, it was unable to rein in the balance of payment (BPO) deficit, which has increased from $140 billion in 1997 to $738 billion in 2007. Figure 1 shows the U.S. debt from 1960 to 2007. The chart clearly shows that the debt rose at a faster rate during republican administrations. The curve is concave during the Clinton administration, when the increase in the debt was the slowest. The Bush administration, to compound the difficulty, has increased U.S. fiscal debt from $5.6 trillion to $9 trillion because of tax breaks and increasing defense expenditures. Taking advantage of the fact that the dollar is the global currency, the Fed prints money whenever it feels necessary in order to fund the two deficits we now have—the trade deficit and the budget deficit. However, these large, accumulating sums are not sustainable.
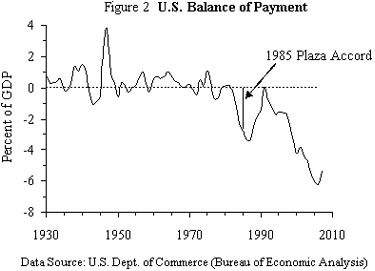
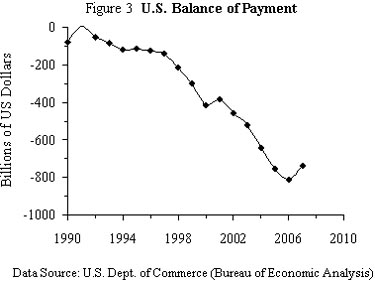
Figure 2 shows the U.S. BOP as a percent of GDP from 1930 to 2007, and Figure 3 shows the BOP in billions of dollars from 1990 to 2007. The BOP has deteriorated very fast since 2000, with the beginning of the Bush administration, and is now in uncharted territory. In terms of percent of GDP, this is the first time the BOP has been allowed to drop to this level in American history. During the mid-1980s when it started going into what was then also uncharted territory, the U.S. had to sign the 1985 Plaza Accord (shown as the vertical line in Figure 2) and cooperated in a controlled depreciation of the dollar in order to increase its exports. At that time, all the main players in the global economy—Japan, West Germany, France, and the U.K.—were dependent on the U.S. for their security and so helped it in this endeavor. China and Russia are the world’s largest and third largest FOREX holders now, however, and most of their FOREX is in dollars; they may not do what the U.S. wants. They have seen the fate of the “bubble economy” of the late 1980s and 1990s in Japan due to the Plaza Accord, and will likely hesitate to sign a similar accord. They may even prefer to see the U.S. economy collapse rather than protect it.
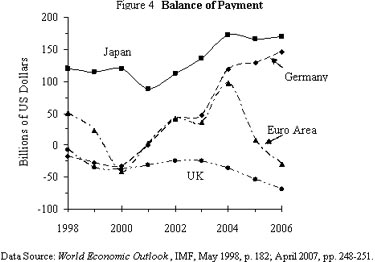
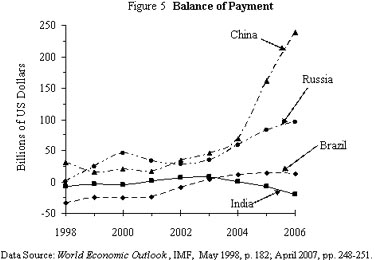
Figures 4 and 5 show the BOP’s of selected countries. All countries except U.K. and India have positive BOPs in the past several years. The main reason behind the negative BOP of India is the import of gasoline. India needs to follow in the footsteps of Brazil and find a substitute for petrol as soon as possible, otherwise it may face an economic crisis because it is the only country in BRIC that has a negative BOP. India has the second highest arable land after the U.S. and hence it can produce a sufficient amount of ethanol. In Brazil, no small vehicles run on pure gasoline; instead they use ethanol-mixed gasoline, which is available all over the country.
Due to the housing crisis, the US trade deficit is expected to reduce slightly. In 2007, the U.S. BOP reduced to $738 billion from $811 billon in 2006. According to April 2008 IMF estimates, the U.S. BOP deficit will continue to be above $600 billion for the next five years – $614 billion in 2008, $605 billion in 2009 and $676 billion in 2013. On the other hand, its two main adversaries, China ($1.5 trillion at the end of 2007, $1.9 trillion at the end of 2008 and $2.4 trillion at the end of 2009) and Russia ($445 billion at the end of 2007, $583 billion at the end of 2008 and $708 billion at the end of 2009) will be amassing FOREX (Foreign Reserves) at alarming rates. It is worth noting that China and Russia had only $168.9 billion and $24.8 billion FOREX, respectively, in 2000.
According to economist Allan H. Meltzer at Carnegie Mellon University, “We [US] get cheap goods in exchange for pieces of paper, which we can print at a great rate.” However, the mountain of U.S. bonds foreigners are accumulating means the country is going deeper into debt to fund its import binge. According to William R. Cline, a scholar at the Institute for International Economics, “Sooner or later, the rest of the world will decide that the U.S. is no longer a safe bet for lending more money.” According to Brad Setser, an economist with Roubini Global Economics, LLC, in New York, in order to pay for its imports the U.S. needs to attract foreign capital at the rate of about $20 billion a week [i.e. to finance $1 trillion dollar twin deficit a year, consisting of $700 billion trade deficit and $300 billion budget deficit]. This is equal to selling three companies the size of the maritime firm supposed to be purchased by Dubai Ports World. “We are basically selling off the furniture to pay for Thanksgiving dinner,” says Peter Morici, a professor at the University of Maryland’s business school in College Park. According to him, foreigners could own within the next decade more than a fifth of the nation’s total $35 trillion or so in assets of every kind – corporations, businesses and real estate.
President Barack Obama is going to spend trillions of dollars in the next couple of years on development projects to get the country out of the present deep recession; but, this huge spending has the potential to crash the entire US economy because of massive foreign debts. It all depends on how foreign investors like China react to these massive new US debts, i.e. it is a million dollar question whether China will cooperate with the US so that the US can spend itself out of a deep recession or not, because China is holding $2 trillion. In a similar situation, the US and German banks did not help Gorbachev in the late 1980s that led to the collapse of the U.S.S.R.
After record-breaking prices in the early 1980s, oil prices plummeted in the second half of the decade. Oil was the main export and source of hard currency for the U.S.S.R. Insufficient investment and lack of modern technology needed to harness hard-to-reach oil fields prevented her from expanding production, however, and in fact Soviet oil production began to decline. The government was also borrowing heavily to modernize its economy. These two factors led to a rise in Soviet external debt. In 1985, oil earnings and net debt were $22 billion and $18 billion, respectively; by 1989, these numbers had become $13 billion and $44 billion, respectively. By 1991, when external debt was $57 billion, creditors (many of whom were major German banks) stopped making loans and started demanding repayments, causing the Soviet economy to collapse.
As discussed in my book, The Modernization Islam and the Creation of A Multipolar World Order, the 1930s Great Depression resulted in the rise of Hitler, who tried to establish a thousand years of Third Reich, but instead paved the way for thriving democracies in most of Europe and decolonization in Asia and Europe. Similarly, the coming Great Depression will result in the collapse of capitalism, a secular and democratic Middle East, and enduring peace for the entire humanity.
Table 1: Total Industrial Potential (U.K in 1900 = 100) (Triennial Annual Averages, except for 1913)
Table 2: Shares of “New Technology” Industries in the Total Manufacturing Output by Regions (in percent)
References
Stiglitz, Joseph, “The Insider: What I Learned at the World Economic Crisis,” The New Republic, April 17, 2000.
Stiglitz, Joseph E., Globalization and Its Discontents, W.W. Norton Co., New York, 2003, p 208.
Ibid., pp. 129-130.
Krugman, Paul, “Fuels on the Hill,” The New York Times, June 27, 2008.
World Economic Outlook, IMF, April 2008, p. 258, and p. 266.
Blustein, Paul, “U.S. Trade Deficit Hangs In a Delicate Imbalance,” Washington Post, November 19, 2005.
Blustein, Paul, “Mideast Investment up in U.S.,” The Washington Post, March 7, 2006.
Fracis, David R., “The U.S. is for Sale – and Foreign Investors are Buying,” The Christian Science Monitor, June 9, 2008.
Sachs, Jeffrey D., The End Of Poverty, The Penguin Press, New York, 2005, p. 132.
Copyright The author 2009

